はじめに
-
ggplot2で作図していると, 軸の目盛りマーク (ticks) は欲しいけどラベルはいらない, という場面に出くわすかと思います. (たとえばここ) - そこで, この処理を簡単にする関数
frabento::label_repl2blank()を作ってみました. -
【重要】
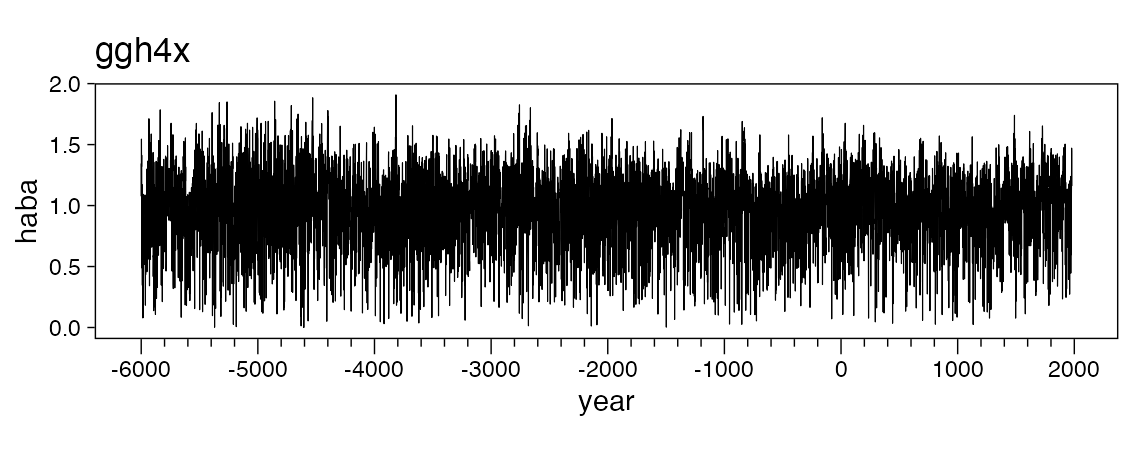
ggh4xという素晴らしい 📦 がCRANにありました. これを使いましょう!
https://teunbrand.github.io/ggh4x/articles/PositionGuides.html
使用例
## devtools::install_github("Gedevan-Aleksizde/fontregisterer", upgrade = "never")
library(frabento)       # このパッケージ
library(tidyverse)      # ggplot2とtidyなデータハンドリング
library(patchwork)      # ggplotを簡単, キレイにレイアウト
library(ggh4x)          # この関数よりもスマートかつエレガントに解決
基本的な使用例
theme_set(theme_linedraw(base_family = "Helvetica") +
          theme(aspect.ratio = 1/4,
                panel.grid = element_blank()))

# Rのtreering (年輪) データを使う
(dat <- tibble::tibble(year =  -6000:1979, haba = treering))
#> # A tibble: 7,980 × 2
#>     year  haba
#>    <int> <dbl>
#>  1 -6000 1.34
#>  2 -5999 1.08
#>  3 -5998 1.54
#>  4 -5997 1.32
#>  5 -5996 1.41
#>  6 -5995 1.07
#>  7 -5994 0.489
#>  8 -5993 1.17
#>  9 -5992 0.887
#> 10 -5991 0.493
#> # ℹ 7,970 more rows

# まずはラベルがごみごみしたx軸の例
g0 <- ggplot(data = dat, aes(x = year, y = haba)) +
    geom_line(size = 0.2) +
    scale_x_continuous(breaks = seq(-6000, 2000, by = 200)) +
    labs(title = "ごみごみX")
#> Warning: Using `size` aesthetic for lines was deprecated in ggplot2 3.4.0.
#> ℹ Please use `linewidth` instead.
#> This warning is displayed once every 8 hours.
#> Call `lifecycle::last_lifecycle_warnings()` to see where this warning was
#> generated.

# x軸のラベルを飛び石にする
g1 <- g0 +
    scale_x_continuous(breaks = seq(-6000, 2000, by = 200),
                       labels = label_repl2blank(nskip = 4)) +
    labs(title = "飛び石X")

# patchwork
g0 / g1 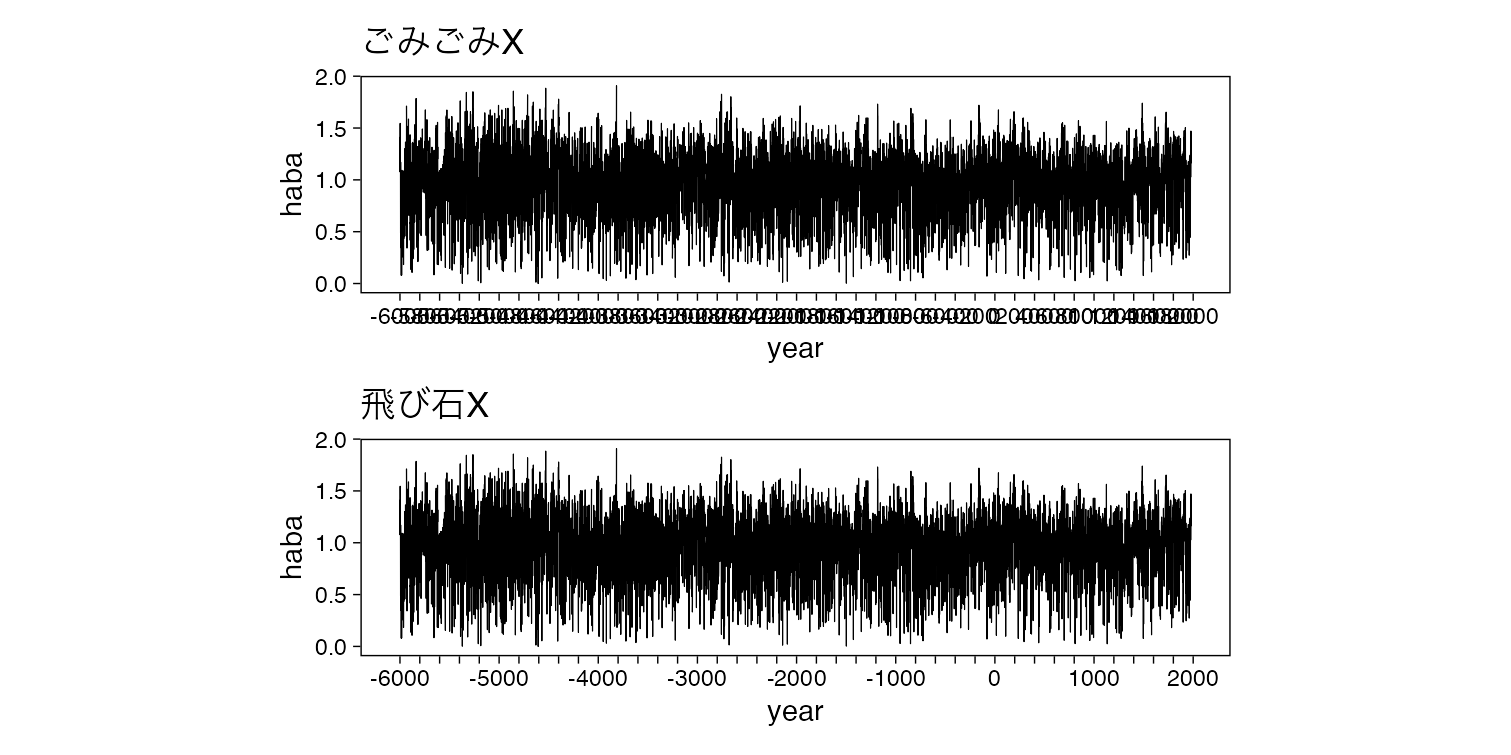
中身解説
label_repl2blank() は中で repl2blank()
が動いています. 具体的な働き方を下記に示します.
通常はこちら
(example_vector <- 2011:2021)
#>  [1] 2011 2012 2013 2014 2015 2016 2017 2018 2019 2020 2021

# デフォルト (引数に何も指定しない)
repl2blank(example_vector)
#>  [1] "2011" ""     "2013" ""     "2015" ""     "2017" ""     "2019" ""
#> [11] "2021"

# nskip を 変える
repl2blank(example_vector, nskip = 2)
#>  [1] "2011" ""     ""     "2014" ""     ""     "2017" ""     ""     "2020"
#> [11] ""

# shift を 変える
repl2blank(example_vector, shift = 1)
#>  [1] ""     "2012" ""     "2014" ""     "2016" ""     "2018" ""     "2020"
#> [11] ""

# first を 変える (一番初めの要素をブランクに. 元からブランクの場合はブランクのまま)
repl2blank(example_vector, first = TRUE)
#>  [1] ""     ""     "2013" ""     "2015" ""     "2017" ""     "2019" ""
#> [11] "2021"

# last を 変える (一番最後の要素をブランクに. 元からブランクの場合はブランクのまま)
repl2blank(example_vector, last = TRUE)
#>  [1] "2011" ""     "2013" ""     "2015" ""     "2017" ""     "2019" ""
#> [11] ""
ブランク位置の逆転 (少しややこい)
# inverse を 変える (ブランクと非ブランクが反転する)
repl2blank(example_vector, inverse = TRUE)
#>  [1] ""     "2012" ""     "2014" ""     "2016" ""     "2018" ""     "2020"
#> [11] ""

# inverse と first を変える (inverseが優先される)
repl2blank(example_vector, inverse = TRUE, first = TRUE)
#>  [1] "2011" "2012" ""     "2014" ""     "2016" ""     "2018" ""     "2020"
#> [11] ""

# inverse と last を変える (inverseが優先される)
repl2blank(example_vector, inverse = TRUE, last = TRUE)
#>  [1] ""     "2012" ""     "2014" ""     "2016" ""     "2018" ""     "2020"
#> [11] "2021"

# inverse と first と last を変える (inverseが優先される)
repl2blank(example_vector, inverse = TRUE, first = TRUE, last = TRUE)
#>  [1] "2011" "2012" ""     "2014" ""     "2016" ""     "2018" ""     "2020"
#> [11] "2021"
留意事項
-
label_repl2blank()はsfクラスのデータをgeom_sf()で描画した時はうまく動作しないようです. 現状, このバグ対応は未定です.