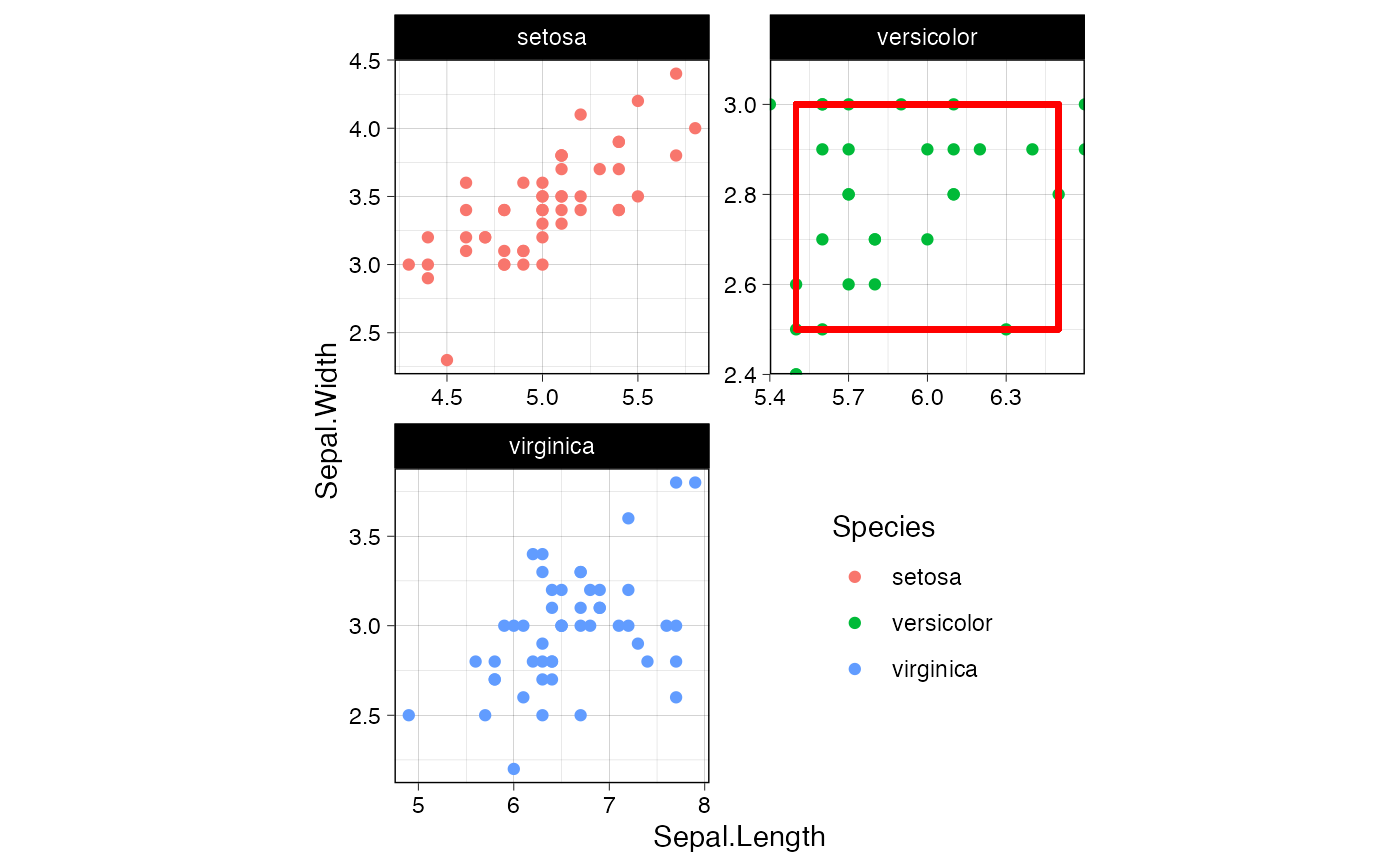
任意のfacetパネルをズームする.
coord_panel_ranges(panel_ranges, expand = TRUE, default = FALSE, clip = "on")Arguments
- panel_ranges
Limits of axes or an axis.
- expand
Add margin to each axes or an axis, Default: TRUE
- default
Is this the default coordinate system? If
FALSE(the default), then replacing this coordinate system with another one creates a message alerting the user that the coordinate system is being replaced. IfTRUE, that warning is suppressed. NOTE: This argument explanation was cited from ggplot2::coord_cartesian- clip
Should drawing be clipped to the extent of the plot panel? A setting of
"on"(the default) means yes, and a setting of"off"means no. In most cases, the default of"on"should not be changed, as settingclip = "off"can cause unexpected results. It allows drawing of data points anywhere on the plot, including in the plot margins. If limits are set viaxlimandylimand some data points fall outside those limits, then those data points may show up in places such as the axes, the legend, the plot title, or the plot margins. NOTE: This argument explanation was cited from ggplot2::coord_cartesian
Value
ggproto object
Details
See vignette("coord_panel_ranges")
References
https://andburch.github.io/ggplot_facets https://stackoverflow.com/questions/63550588/ggplot2coord-cartesian-on-facets
See also
Examples
library(frabento)
library(ggplot2)
library(magrittr)
#>
#> Attaching package: ‘magrittr’
#> The following objects are masked from ‘package:testthat’:
#>
#>     equals, is_less_than, not

theme_set(theme_linedraw(base_family = "Helvetica", base_line_size = 0.3) +
          theme(aspect.ratio = 1/1, legend.position = c(0.75, 0.25)))

ggplot(iris, aes(x = Sepal.Length, y = Sepal.Width)) +
    geom_point(aes(color = Species)) +
    geom_rect(data = .  %>% dplyr::filter(Species == "versicolor"),
              xmin = 5.5, xmax = 6.5, ymin = 2.5, ymax = 3,
              color = "red", linewidth = 1, fill = NA) +
    facet_wrap(~ Species, scale = "free", ncol = 2) +
    coord_panel_ranges(panel_ranges = list(
        list(NULL),
        list(x = c(5.4, 6.6), y = c(2.4, 3.1)),
        list(NULL)
    ))